Tuesday, April 29, 2008

Guest on the 10th Muse Podcast

I was just a guest on the 10th Muse Podcast, episode 21.

We hit some good conversation topics, including:
  • Cutting room floor, where does it all go, are some of the best ideas there?
  • Innovation in games, how important, and how much is there?
  • Games benefiting all of humanity, or are just filler for the gamer niche?
  • GTA using Natural Motion's Euphoria, will NM get the credit, or will GTA soak it all up. How does it feel to work on middle-ware when games take all the publicity?
  • Consequences in games, e.g. to your own character, the virtual world, the supporting characters, the story line, AI, etc.
I ended up referencing a few things:

Sunday, April 27, 2008

Depend on Dependency Macros for Visual Studio Project Dependencies


[update: fixed code typo]

I set dependencies on visual studio projects frequently. Here is some macro code that simplifies that process.

At the last 2 studios I joined one of the first things I did was to make an "All" solution. A single visual studio solution containing all projects required to build the game (or in Gamebryo's case, engine, samples, & tools).

A nice big solution like that needs to have dependencies set right. Visual Studio's interface for doing this is inefficient for anything but toy "solutions". But, they gave us macros, and it's easy to set dependencies with those.

Example solution file, with projects broken into logical groups

With these macros, you first select a group you would like to change the dependency information for. Run macro Step1. Then, select the group of projects that all the previous projects depend on. You'll then see this window:
Macro Dialog confirming dependencies about to be set.

Setting dozens or hundreds of project dependencies is a breeze with these macros.

Here's the code (Visual Studio 2005 macros, aka VS8):


Imports System
Imports EnvDTE
Imports EnvDTE80
Imports System.Diagnostics

' Need List:
Imports System.Collections.Generic

Public Module Module1
Sub Step1_SelectDependentProjects()
'DESCRIPTION: Step 1 of 2 for setting dependencies on projects
SelectedProjects = GetSelectedProjects()
Dim OutputString As String
OutputString = SelectedProjects.Count.ToString
OutputString += " Selected Projects:" + vbLf
OutputString += GetStringOfEachProject(SelectedProjects)
MsgBox(OutputString)
End Sub

Sub Step2_SelectDependeeProjects_AssignDependencies()
'DESCRIPTION: Step 2 of 2 for setting dependencies on projects
If SelectedProjects Is Nothing Then
MsgBox("You must first select projects to have dependencies set on, with SelectDependentProjects macro")
Return
End If

Dim DependentProjs As List(Of EnvDTE.Project) = SelectedProjects
Dim DependeeProjs As List(Of EnvDTE.Project) = GetSelectedProjects()

Dim OutputString As String
OutputString = "Are you sure you want to set" + vbLf + vbLf
OutputString += DependentProjs.Count.ToString + " Projects:" + vbLf
OutputString += GetStringOfEachProject(DependentProjs) + vbLf + vbLf

OutputString += "As dependent upon" + vbLf + vbLf
OutputString += DependeeProjs.Count.ToString + " Projects:" + vbLf
OutputString += GetStringOfEachProject(DependeeProjs) + vbLf + vbLf

If MsgBox(OutputString, MsgBoxStyle.OkCancel) = MsgBoxResult.Cancel Then
Return
End If

For Each Dependent As EnvDTE.Project In DependentProjs
For Each Dependee As EnvDTE.Project In DependeeProjs
Try
DTE.Solution.SolutionBuild.BuildDependencies.Item(Dependent).AddProject(Dependee.UniqueName)
Catch ex As System.Exception
Dim Result As Microsoft.VisualBasic.MsgBoxResult
Result = MsgBox("Failed to add dependency: " + vbLf _
+ "Dependent: " + Dependent.Name + vbLf _
+ "on" + vbLf _
+ "Dependee: " + Dependee.Name + vbLf + vbLf _
+ "Error is:" + vbLf + ex.Message + vbLf + vbLf _
+ "CONTINUE????", MsgBoxStyle.YesNo)
If Result = MsgBoxResult.No Then
Return
End If
End Try
Next
Next
MsgBox("Done.")
End Sub

' Storage for list of projects:
Public SelectedProjects As List(Of EnvDTE.Project)

' Helper functions:
Function GetSelectedProjects() As List(Of EnvDTE.Project)
Dim projs As List(Of EnvDTE.Project) = New List(Of EnvDTE.Project)
For Each selectedItem As EnvDTE.SelectedItem In DTE.SelectedItems
Try ' to get projects
If Not selectedItem.Project Is Nothing Then
If Not projs.Contains(selectedItem.Project) Then
projs.Add(selectedItem.Project)
End If
End If
Catch
End Try
Next
Return projs
End Function

Function GetStringOfEachProject(ByVal ProjectsList As List(Of EnvDTE.Project)) As String
Dim OutputString As String = ""
For Each proj As EnvDTE.Project In ProjectsList
If OutputString.Length > 0 Then ' add new line
OutputString += vbLf
End If
OutputString += " " + proj.Name
Next
Return OutputString
End Function

End Module

Monday, April 21, 2008

The Game Architect Speaks

image by todbot on flickr
Game Architect doesn't update often, but when Kyle posts it's worth the read.

Definitely read his GDC 2008 wrap up, and if you're into engines, read his thoughts on Day 1 Studio's Despair Engine.

I especially enjoyed the engine section on orthogonal hierarchies, a topic I've discussed with many before regarding scene graphs. He mentions that they've split what many have overloaded into a single scene graph into at least 5 hierarchies.

Gamebryo Powered Games

I work on Gamebryo.
Gamebryo has been used on hundreds of games.
Our website had a nice recent update that listed dozens more games.

Like, Speedracer. ;) Which is ridiculous, but, still.. go, speedracer, go!

Saturday, April 12, 2008

An Inline ASCII Bar Chart Technique for Spreadsheets

Here's an article with a neat inline ASCII bar chart technique for spreadsheets.

So, you're a programmer, game designer, artist, producer, or... just about anyone. Chances are you've used Excel. You may even use it to look at data!

Look, here's some generic data (Fig. 1):

Wouldn't it be much easier to look at with a chart? Why not build a chart right into the spreadsheet, along side the data (Fig. 2):
Note the bar graphs adjacent to the data columns from above

Real data may have 100s or 1,000s of rows, with several columns. Being able to skim through the spreadsheet and have the data graphically represented inline is often a big win for readability and locality.

The technique is simple. Excel has a formula to repeat a string several times. For the "Range" graph, the formula is just =REPT("#", D). This works out nicely because the values are integer and small.

The "Value" data takes just a bit more work, but is still trivial to write. Here I've used =REPT("|", F6*20), (Fig. 3)

With just a bit more work, we can setup a nice general formula that can be tweaked for each data range, and is more robust. Also, setting the font of the graph to "Small Fonts" with a point size of 4 give us single pixel accuracy in our bar chart, see (Fig. 4).

Note the broken bar indicating overflow for the first 2 lines,
the easily configurable min max range,
and the single pixel accuracy of the bars.

Each row of the bar chart uses the formula:
=LEFT(CONCATENATE(REPT("|",E$57-1),">"),MAX(0,(D34-E$53)/(E$55-E$53)*E$57))

Let me break it down:

I'm going to substitute names instead of cell references, so it's easier to follow along:
(If you don't know about them, try selecting a cell and using Insert/Name/Define and Insert/Name/Apply some time. But, it's out of the scope of this article)

Ok, the formula is then:
=LEFT(CONCATENATE(REPT("|",Chars-1),">"),MAX(0,(DataValue-Min)/(Max-Min)*Chars))

First, we want to map the data values between Min and Max to appear on the bar chart, so we normalize to 0-1 range:
=LEFT(CONCATENATE(REPT("|",Chars-1),">"),MAX(0,(DataValue-Min)/(Max-Min)*Chars))

Then, multiply by the max number of characters we want a bar chart line to have:
=LEFT(CONCATENATE(REPT("|",Chars-1),">"),MAX(0,(DataValue-Min)/(Max-Min)*Chars))

Then, we want to clamp to positive numbers only, so that data values less than our minimum value don't break our graph:
=LEFT(CONCATENATE(REPT("|",Chars-1),">"),MAX(0,(DataValue-Min)/(Max-Min)*Chars))

That gives us the number of characters to display. But, we would like to visually show when the data values are larger than the bar chart can show. So, instead of taking the number so far and giving it to REPT, we give it to LEFT. Left will take N characters from a string, and we'll terminate that string with a > symbol to show that the graph is maxing out. The equation could be as such:
=LEFT("|||||||||||||||||||||||||||||>",MAX(0,(DataValue-Min)/(Max-Min)*Chars))

But, hard-coding the number of characters on the graph is a draw back. We want to be able to copy and paste this solution around, and scale the graph up as needed. So, we use REPT to generate the |||||||| characters, and concatenate with the final >
=LEFT(CONCATENATE(REPT("|",Chars-1),">"),MAX(0,(DataValue-Min)/(Max-Min)*Chars))

The controls for the graph can be put in the column of the graph above or below the data. We can easily have several columns of bar charts, each with tunable parameters.

I use this technique frequently, I hope you keep it in mind (at least the simple version) the next time you're trolling over data in Excel.

Tuesday, April 8, 2008

Ikaruga on Xbox Live Arcade


Ikaruga is a great shooter, and a game worth playing on Live Arcade. (Sadly, so many aren't)

Game's available Wednesday April 9th.

From: gamerscoreblog

(Image under creative commons Attribution-Share Alike 2.0 Generic license, thanks gamerscoreblog)

Sunday, April 6, 2008

Higher fidelity depth of field effects arriving in games

Photo by Brian Talbot - Used by Creative Commons Attribution-Noncommercial permissionCinematic shots in movies and television shows use depth of field frequently. Decorative point lights in the background pushed out of focus are a familiar image. You can try it when your out at lunch by ordering a cola, and blurring your vision as you stare at the ice cubes. The bright highlights will blossom out.
The Playstation 2 had excellent fill rate, enabling the over use of blur in many games. Combined with masking or thresholding, this was were we saw the mass emergence of (cheap) high dynamic range effects in games. Though, the "high" in this case wasn't very high, and most of the effect was just the blur.

Those blurs were typically a separable Gaussian blur, for performance reasons. The separable blur is just a horizontal then vertical blur, O(n) instead of O(n^2) for a general case 2D blur.

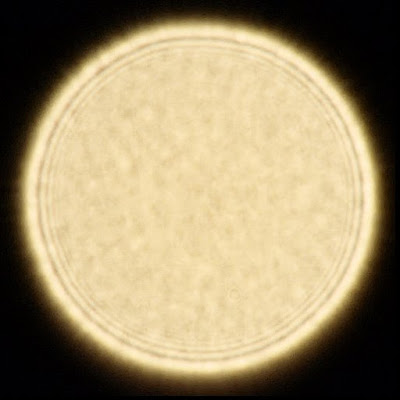
A Gaussian blur, however, is not the effect created when a point light is out of focus in a camera. The proper convolution varies a bit from camera to camera, but here is an example taken with my SLR:


This shape is primarily a constant intensity circle, with diffusion ringing near the edges. High quality cinematic cameras will also often show the aperture edges, however in my camera there was too much flaring to see these. Pay attention in a movie, however, and you're likely to see octagons instead of circles.

To illustrate a cross section of the intensity (hey, why not) I've done the following in Photoshop:

Unwrapped the image with polar coordinates:


Smoothed the image with a strong horizontal blur:


Added a gradient:


Applied a threshold:


The result is a graph where the center of the disk is at the top, and the outer edge at the bottom. The distance along the X axis indicates the intensity.

The diffraction ringing near the edge is clearly visible, with the center of the disk being approximately a constant intensity.

There is still some noise towards the top of the profile, which is from the center of the image. That is due to the noise that appeared there, and was not blurred by the horizontal blur. (It was stretched out when unwrapping the polar coordinates).

To render this effect on ~2008 era GPUs is a heavy weight operation. However, some games have done so, e.g. Lost Planet's port to DirectX. (Beyond 3D article) They had extra processing power to spend when porting from the Xbox 360 to DirectX 10 cards such as the GeForce 8800.

Instead of horizontally & vertically blurring the image, for each point a triangle is rendered to a small area with its intensity modulating a texture. For a single bright pixel, the result is a copy of the convolution texture around that point. (Read their article for details on scene segmentation and geometry shader usage.)

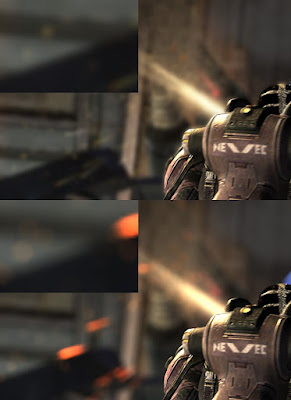
Here I've highlighted the effect in two Lost Planet images from www.4gamer.net (1 and 2). The top images show the standard Guassian blur, the bottom images show the texture effect.
Click image for larger view.
Compare the blurry sparks on top
to the hexagon out of focus sparks on bottom.

Note they were able to increase the size of the blur with the texture effect, because it remained cinematic. That size of a Gaussian blur would just look muddy.

Try it at home: In Photoshop try opening up a image you have with small point lights, or just make one with a black background and a few small white dots. Give it a go with
Filter / Blur / Gaussian Blur and
Filter / Blur / Lens Blur.

Conclusion: Crisp cinematic depth of field effects require a distinctive convolution kernel. Real time graphics will move beyond separable Gaussian blurs.

Update: More discussion here: motivating-depth-of-field-using-bokeh
Update: Nice technique writeup in 3DMark11